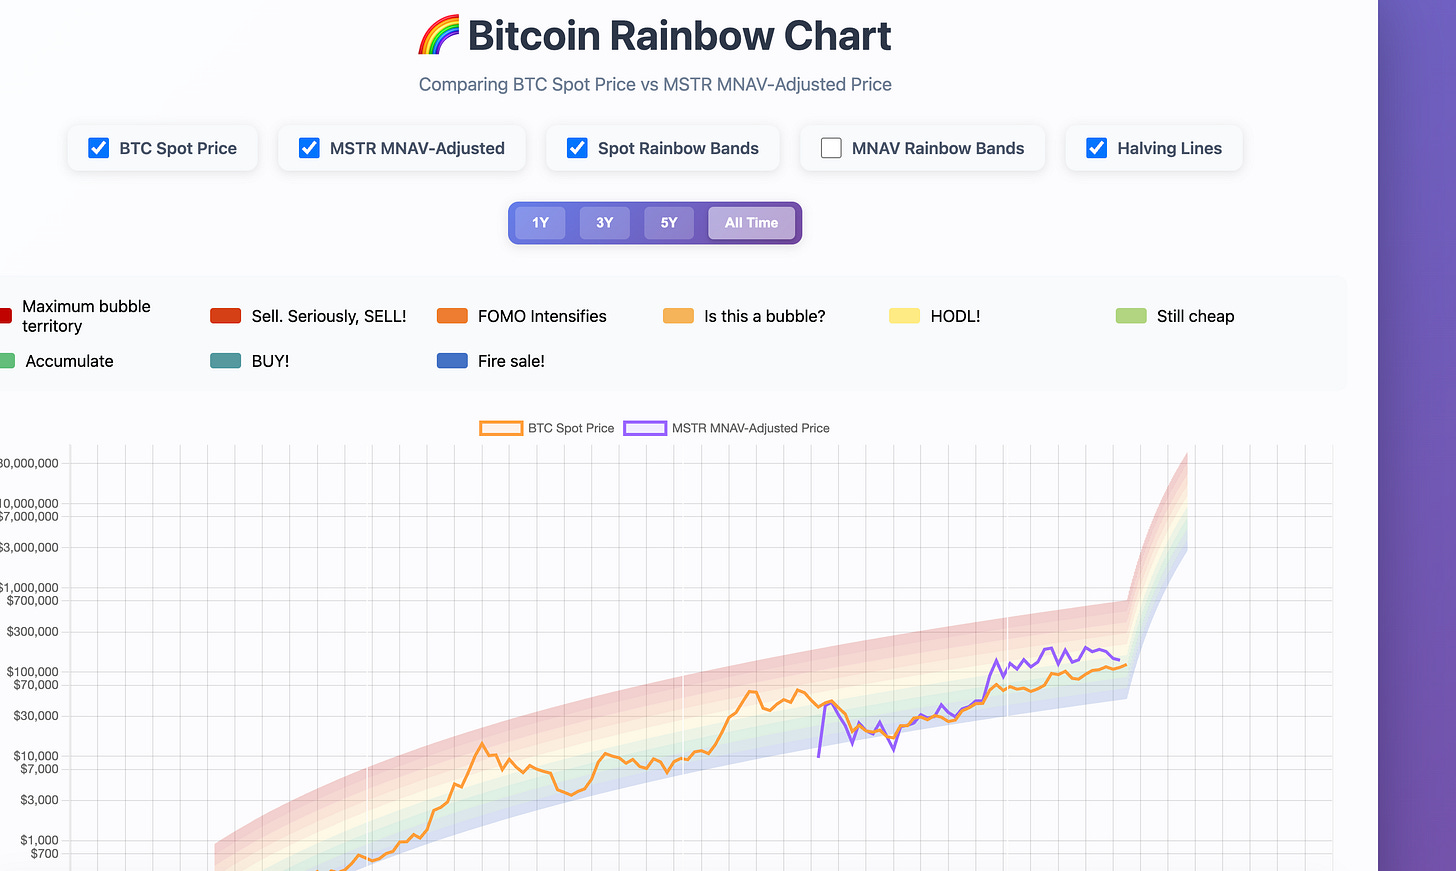
I built a thing . The Strategy Rainbow Chart
This chart shows the traditional rainbow chart line along side of a MSTR adjusted btc price to see if the havening pattern better fits the MSTR MNAV or the BTC spot.
The Protocol and the Cycles
The Bitcoin network runs on predictable, hard-coded scarcity.
1. The Halving: A Scarcity Enforcement Function
The Bitcoin Halving is a scheduled protocol execution that cuts the new supply of coins by fifty percent. Every four years, the supply curve shifts. The historical price response is a side effect of this scarcity meeting static or growing demand. The whole system relies on a basic consensus mechanism: people agree that the scarcity function matters.
The Dip is the Test: A Volatility Check
The wild price swings the network experiences are the inevitable volatility baked into an asset whose valuation is purely speculative, backed only by consensus. The dip is the market’s way of testing the network’s participants. Will you sell your coins back to the system under duress? Or will you HODL and demonstrate that you are a durable node in the consensus mechanism?
2. The Rainbow Chart: Logging Mass Psychology
The Rainbow Chart is simple. It’s a logarithmic channel over time. It doesn’t predict the future; it merely catalogs where mass human psychology has placed the price historically.
Red bands show where people get irrationally exuberant.
Blue bands show where they get irrationally depressed.
It maps the predictable emotional swing as the price works its way through the cycles enforced by the Halving schedule.
MicroStrategy’s strategy is clear: acquire Bitcoin and use debt/equity to leverage that position. This turns the company into a publicly traded, highly concentrated BTC bet. To measure MSTR’s true exposure, we track its MNAV (MicroStrategy Net Asset Value)—the actual Bitcoin assets plus the residual business value, per share. The market price of MSTR stock rarely aligns with the MNAV. The difference is the narrative premium. The MSTR price is essentially the market’s bet on the company’s ability to successfully run its arbitrage play.
The MNAV Rainbow Chart: Judging the Reward
Every cycle, we expect the “Rapture”—the price appreciation that validates the long HODL. This cycle feels different. When looking at the raw BTC Spot Price, the reward doesn’t feel as intense; the price doesn’t fully hit those peak euphoria bands. We expect some loss of volatility, but this dampening is more than most expected.
But the reward was simply delivered through a different channel: the MSTR MNAV.
My chart tracks the MSTR MNAV-Adjusted Price alongside the Spot Price. The key takeaway is:
MSTR has manipulated its narrative to fit the reward. MSTR’s leadership is highly attuned to its MNAV. By continually enforcing a strong pro-BTC narrative and structuring the corporate finances, MSTR successfully convinced the market to value its stock in the upper Rainbow bands before the raw BTC Spot price fully got there.
The corporate vehicle redeemed the faithful first. While the protocol price might have lagged, the corporate MNAV effectively front-ran the expected reward.
The BTC MNAV Rainbow Chart shows you if the raw price is still being tested, or if the corporate narrative has already passed the test and collected the reward. It’s a necessary tool for separating the engineering reality from the corporate storytelling.